

.svg)
Risk Management in the Oil & Gas Industry
Oil and gas projects operate in highly intricate environments. From pipelines to refineries, every phase carries unique challenges. Whether the work is happening along a pipeline corridor, at a terminal, or inside a refinery, you need clear, accurate site information to plan safely and keep work moving.
Outdated or missing records can lead to big problems quickly. When information is scattered across teams, issues like design conflicts, utility strikes, delays, budget overruns, and risks for workers and nearby communities can arise.
That matters even more when you consider the size of the industry.
According to the Environmental Protection Agency (EPA), “The oil and gas sector is the largest energy producer in the U.S., responsible for about 74% of primary energy production.”
When all stakeholders can work from the same up-to-date, digitized information, your team can:
- Reduce risk
- Stay coordinated
- Move projects forward with confidence
This applies across upstream, midstream, and downstream operations.
What Are the Oil & Gas Industry Segments?
The oil and gas industry has three main segments: upstream, midstream, and downstream. Together, these segments form the hydrocarbon value chain. This process begins with finding and producing resources. Next, it involves transportation and storage. Finally, it ends with refining and distribution. Large integrated companies might join all three areas, and other companies often focus on just one segment. Their choice depends on their assets, expertise, and market goals.
Upstream
The upstream segment focuses on finding and producing oil and natural gas. This segment includes exploration, drilling, field development, and production. In practical terms, this is the front end of the industry. Operators identify hydrocarbon reserves, drill wells, and complete them. They also bring crude oil and natural gas to the surface for initial handling and transfer.
This segment has some of the industry’s highest technical and financial risk, because no operator can fully predict the outcome of a well before drilling starts. The key uncertainties include:
- Reserves
- Reservoir quality
- Expected production
- Commodity prices
Upstream work requires capital, technical precision, and disciplined risk management. In 2025, upstream activity in the United States hit a record high. Crude oil production averaged 13.6 million barrels per day, based on the EIA data. That new annual record shows how central exploration and production remain to the domestic energy supply.
Midstream
The midstream segment connects upstream and downstream. This segment deals with gathering, transporting, storing, and transferring crude oil, natural gas, and natural gas liquids (NGL). Midstream relies on a broad network of infrastructure and logistics systems.
Thomson Reuters Practical Law states that “Oil and NGLs may be transported by ship, rail, pipelines, and truck. Because gas takes up a lot of space, it is primarily transported via pipelines or in specially designed vessels in the form of liquefied natural gas.”
However, pipeline construction requires a significant upfront investment because midstream infrastructure operates at an enormous scale. For example, the Pipeline and Hazardous Materials Safety Administration (PHMSA) oversees more than 3.4 million miles of pipelines. These systems transfer almost all the natural gas used in the U.S. and about two-thirds of hazardous liquid petroleum products.
Downstream
The downstream segment converts raw hydrocarbons into finished, usable products. This segment includes:
- Refining
- Processing
- Blending
- Marketing
- Distribution
These assets make the segment closest to commercial and consumer demand. Refineries and processing facilities turn crude oil and natural gas into products such as gasoline, diesel, jet fuel, lubricants, asphalt, petrochemical feedstocks, and pipeline-quality gas.
Downstream operations require reliable, high-value equipment across refineries, processing plants, and storage facilities. industrial systems. Refining processes include major units such as:
- Atmospheric distillation
- Catalytic cracking
- Catalytic reforming
- Hydrocracking
- Hydrotreating
All these units separate, upgrade, and treat hydrocarbons into marketable products. These products include fuel retail, wholesale distribution, chemical sales, and aviation fuel.
How the Oil & Gas Segments Work Together
These three segments operate as a continuous system rather than as isolated silos. Upstream gathers raw hydrocarbons. Midstream transports and stores them. Downstream turns the hydrocarbons into finished products and delivers them to the market. Each segment performs a distinct function, but none can operate effectively without the others.
That structure also explains why the oil and gas industry relies on such a wide range of disciplines. These include geology, drilling, engineering, logistics, processing, refining, integrity management, and large-scale infrastructure operations.
What is the Oil & Gas Industry Outlook?
Oil and gas companies enter 2026 with a more selective growth mindset. Deloitte's 2026 Oil and Gas Industry Outlook expects operators to balance policy-driven opportunities against weaker macro conditions, lower oil prices, and continued pressure on margins. That means many companies will stick to capital discipline. This will happen even as supportive U.S. policies create new chances for drilling, expanding acreage, and developing infrastructure.
U.S. natural gas and liquefied natural gas (LNG) companies plan to boost spending and grow their shale positions. This comes as demand for liquefied natural gas (LNG) rises and data centers increase their power needs.
These trends support a strong future for natural gas. Oil producers, on the other hand, are more likely to hold off on increasing investment. They prefer to see a clearer improvement in global supply and demand first.

Deloitte also reports that nearly “70% of the U.S. oil and gas companies it analyzed plan to restructure portfolios, optimize costs, or divest noncore assets, while many continue directing a large share of cash flow to dividends and buybacks.”
In other words, the industry outlook predicts targeted growth, capital discipline, and higher-return assets over broad-based expansion.
Cost Pressures
Cost pressure remains one of the clearest constraints on industry growth. Deloitte highlights 10% to 25% tariff actions on crude feedstocks, steel, and aluminum that don't comply with the United States-Mexico-Canada Agreement (USMCA). This agreement highlights that equipment like compressors and pumps are major cost drivers that could reshape the sector’s economics.
Oil and gas operators depend on materials and equipment from around the world. So, even small changes in trade policy can raise procurement costs for upstream, midstream, and downstream projects.
Deloitte estimates that “The announced US tariffs on these components and key input materials, including steel, aluminum, and copper, could increase material and service costs across the value chain by 4% to 40%, potentially compressing industry margins.”
As a result, many companies will likely change their procurement strategies to decrease volatility exposure. As documented in Deloitte industry outlook, this could involve operators to:
- Diversify suppliers
- Depend more on domestic or non-tariffed sourcing
- Boost local fabrication when possible
- Update contracts to share cost escalation risks with EPC firms and vendors
Scaling LNG
LNG remains one of the strongest growth drivers in the oil and gas outlook. The IEA expects global natural gas demand growth to accelerate in 2026 after slowing to less than 1% in 2025. The agency also expects global LNG supply growth to exceed 7% in 2026, marking the fastest pace of expansion since 2019.
North America will lead much of that expansion.
“North America is set to account for the vast majority of the 40 bcm increase,” per the IEA.
Investment activity also remains strong. In 2025, over 90 bcm per year of liquefaction capacity reached a final investment decision. This decision was marked the second-highest annual total ever recorded, with the United States accounting for more than 80 bcm of approved annual capacity.
Digital Transformation
Digital transformation is shifting from experimentation to scaled deployment.
According to Oleg Fonarov, CEO of Program-Ace, and author of Forbes' Trends In Digital Transformation In The Oil & Gas Industries, “relying on outdated methods entails higher costs, unexpected failures and unnecessary risks.”
Fonarov also states that “…using digital tools isn’t just about keeping up with trends. It’s a way to work smarter, cut unnecessary costs and create a safer, more efficient environment for everyone in the industry.”
More oil and gas companies are expected to move beyond isolated pilots and push advanced technologies, especially:
- Real-time analytics
- Cloud platforms
- Internet of Things (IoT)-enabled sensors
- Digital twins
- Artificial intelligence (AI) and machine learning (ML)
.webp)
Energy, Oil, & Gas Magazine notes that “automated workflows reduce human error and boost safety.”
Upstream operators use advanced seismic imaging and AI to improve drilling accuracy. Downstream refineries rely on predictive analytics to fix maintenance issues before they turn into costly disruptions.
How Does the Oil & Gas Industry Leverage Digital Twins?
The oil and gas industry uses digital twins to create dynamic virtual representations of physical assets and systems. Operators update these models with real-time operational data, historical information, and advanced analytics.
IBM explains that this approach helps operators:
- Predict future behavior
- Improve operational efficiency
- Gain deeper insight into critical asset performance in the field
IBM states that, “one of the most beneficial applications of digital twins in the oil and gas industry is predictive maintenance (PdM).”
As mentioned previously, operators can spot maintenance needs sooner. This way, they can reduce unplanned downtime and find potential failures before they occur. Digital twins also support improvements in efficiency, safety, and asset optimization. They help improve operations across upstream, midstream, and downstream.
How Can GPRS Support Oil & Gas Projects?
GPRS supports oil and gas projects across the country, from pipeline corridors to refinery facilities, delivering comprehensive site visualization both above and below-ground.
GPRS’ Services Include:
1. Utility Locating:
- Identifies, marks, and maps underground infrastructure such as pipelines, tanks, and additional buried utility lines
- Supports safer work across upstream fields, midstream corridors, and downstream facilities
- Reduces the risk of utility strikes, environmental accidents, and costly project delays
- Learn more about GPRS’ Utility Locating Services
2. Concrete Scanning:
- Identifies rebar, conduits, and post tension cables before coring, cutting, or drilling
- Protects slabs, well pads, and structures during refinery upgrades and plant modifications
- Reduces risk during tie-ins, anchoring, crane setup, and shutdowns
- Learn more about GPRS’ Concrete Scanning Services
3. 3D Laser Scanning:
- Saves time, money, and headache compared to manual measurement methods
- Captures 2-6mm accurate, real-world documentation of refineries, offshore platforms, and pipelines
- Improves coordination by giving architects, contractors, and engineers a shared view of as-built site conditions
- Learn more about GPRS’ 3D Laser Scanning Services
4. Video Pipe Inspection:
- Inspects water, sewer, and lateral pipelines using a robotic crawler, lateral launch, and push cameras
- Helps locate clogs, cross bores, structural faults, and pipe damage before maintenance, repairs, or tie-ins
- Delivers NASSCO-certified WinCan reports with the exact location, video, photo, and severity for each defect
- Learn more about GPRS’ Video Pipe Inspection Services
5. Leak Detection:
- Non-destructive method to pinpoint hidden leaks in water distribution and/or fire suppression systems
- Helps reduce downtime, repair costs, and system loss in active plants, terminals, and refineries
- Enables you to address leaks early to avoid damage to the surrounding ground and structures
- Learn more about GPRS’ Leak Detection Services
SiteMap®
- Stores all your utility maps, KMZ files, CADD/BIM deliverables, and virtual tours for instant access
- User-friendly and customizable GIS platform
- Break down information silos to enhance safety, reduce costs, and plan with confidence
- Learn more about GPRS' infrastructure visualization platform, SiteMap
GPRS utilizes a “boots on the ground” approach and deploys Subsurface Investigation Methodology (SIM)-Certified Project Managers across the country to provide in-person field services.
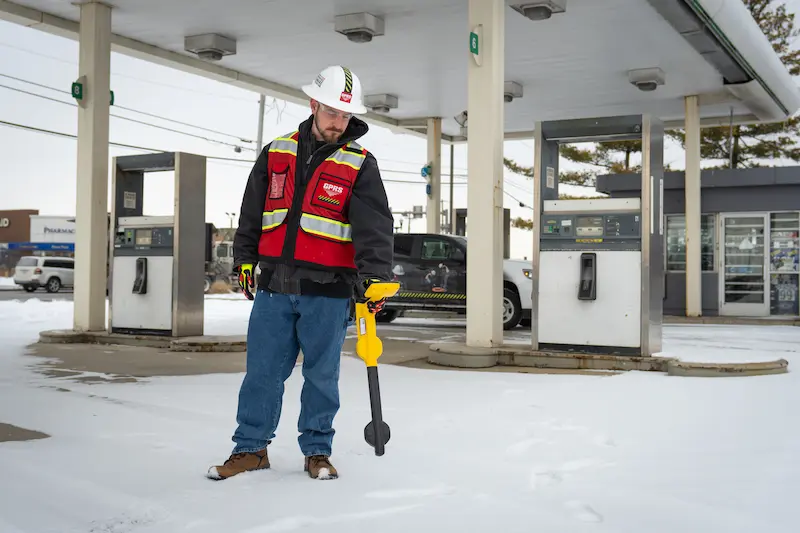
Case Study: GPRS Utility Locate and 3D Laser Scan for a Gas Station
A gas station needed precise utility locating and as-built documentation to support planned site upgrades and strengthen emergency response planning for potential leaks. GPRS delivered 2D utility maps, a 3D BIM model, and a conceptual site model (CSM) documenting the gas station, underground storage tank (UST) system, and surrounding infrastructure. Read the full case study.
.webp)
Problem
- The gas station lacked reliable as-built site data needed for environmental compliance, upgrade planning, and emergency response
- The client did not have an accurate CSM to understand the likely contaminant fate and transport in the subsurface
Solution
- GPRS Project Managers performed utility locating, video pipe inspection, leak detection, 3D laser scanning, and drone photogrammetry to document existing structural and subsurface conditions
- The CADD/BIM Team delivered data in point cloud, 2D maps, and 3D BIM formats to improve planning, reduce uncertainty, and help the client avoid dangerous mistakes
- The deliverables gave the client accurate site data to support drilling, leak assessment, and upgrade planning
Benefits
- Infrastructure locating and mapping supports safer subsurface work, including soil borings and concrete coring for vapor pins, by reducing clashes and utility strikes
- Accurate as-built maps and models help teams avoid damaging USTs, system components, and buried utilities during investigation and sampling
- Site data stored in GPRS' SiteMap supports stakeholder access, leak response planning, CSM development, and more-informed remediation decisions
Accurate structural and subsurface information helps you reduce risk, improve coordination, and make informed decisions in complex project environments. GPRS provides field-verified data and full-site visualization to support safer planning, streamlined communication, and more efficient execution across upstream, midstream, and downstream work.
Let us help you digitize your oil and gas operations. What can we help you visualize?
Frequently Asked Questions
What is utility locating?
Utility locating is the process of identifying, marking, and mapping buried private and/or public utilities before excavation, drilling, or coring begins. Utility locating helps contractors avoid utility strikes, reduce clashes, and verify existing site conditions. GPRS can locate private and public utilities and provide digital utility maps with depth information for oil and gas projects nationwide. Learn more about GPRS’ Utility Locating Services here.
What is 3D laser scanning?
3D laser scanning is a reality capture method that records accurate existing site conditions that is then processed into one cohesive point cloud. General contractors use this method to document architectural, structural, and MEP systems for planning, clash detection, and facility modifications. GPRS’ CADD/BIM Team can turn that scan data into 2D CAD drawings, 3D BIM models, 3D mesh models, and virtual tours for easier field, design, and office coordination. For example, GPRS used 3D laser scanning for a midstream energy project to capture flange data for gas processing and transportation components so the client could speed up prefabrication and reduce field changes in this case study: 3D Laser Scans Gas Processing and Transportation Components.
What is the difference between BIM models and digital twins?
A BIM model is a detailed, static, digital model used mainly for design and construction, while a digital twin adds live data to show how an asset performs over time. BIM is most valuable during planning and building, and digital twins are most valuable during operations and maintenance. GPRS delivers 3D BIM models, which can serve as the building blocks to your digital twins. Learn more about the difference between 3D BIM models and digital twins here.
How does GPRS create a conceptual site model (CSM)?
GPRS creates the utility portion of a conceptual site model by collecting accurate field data on buried infrastructure and existing site conditions. That data can identify likely liquid migration pathways and potential voids where soil vapor could introduce additional hazards. SiteMap can then store a CSM and geolocated, layered utility data so stakeholders can quickly access and share current site records.