
.svg)

.svg)

PROTECT AND MAINTAIN YOUR WATER & SEWER INFRASTRUCTURE

SEE
Everything: Aboveground and Below
SAVE
Time, Money, Lives & Resources
support
Your Infrastructure’s Future
Learn Industry-Leading Best Practices from Water & Wastewater Infrastructure Pros

SEE
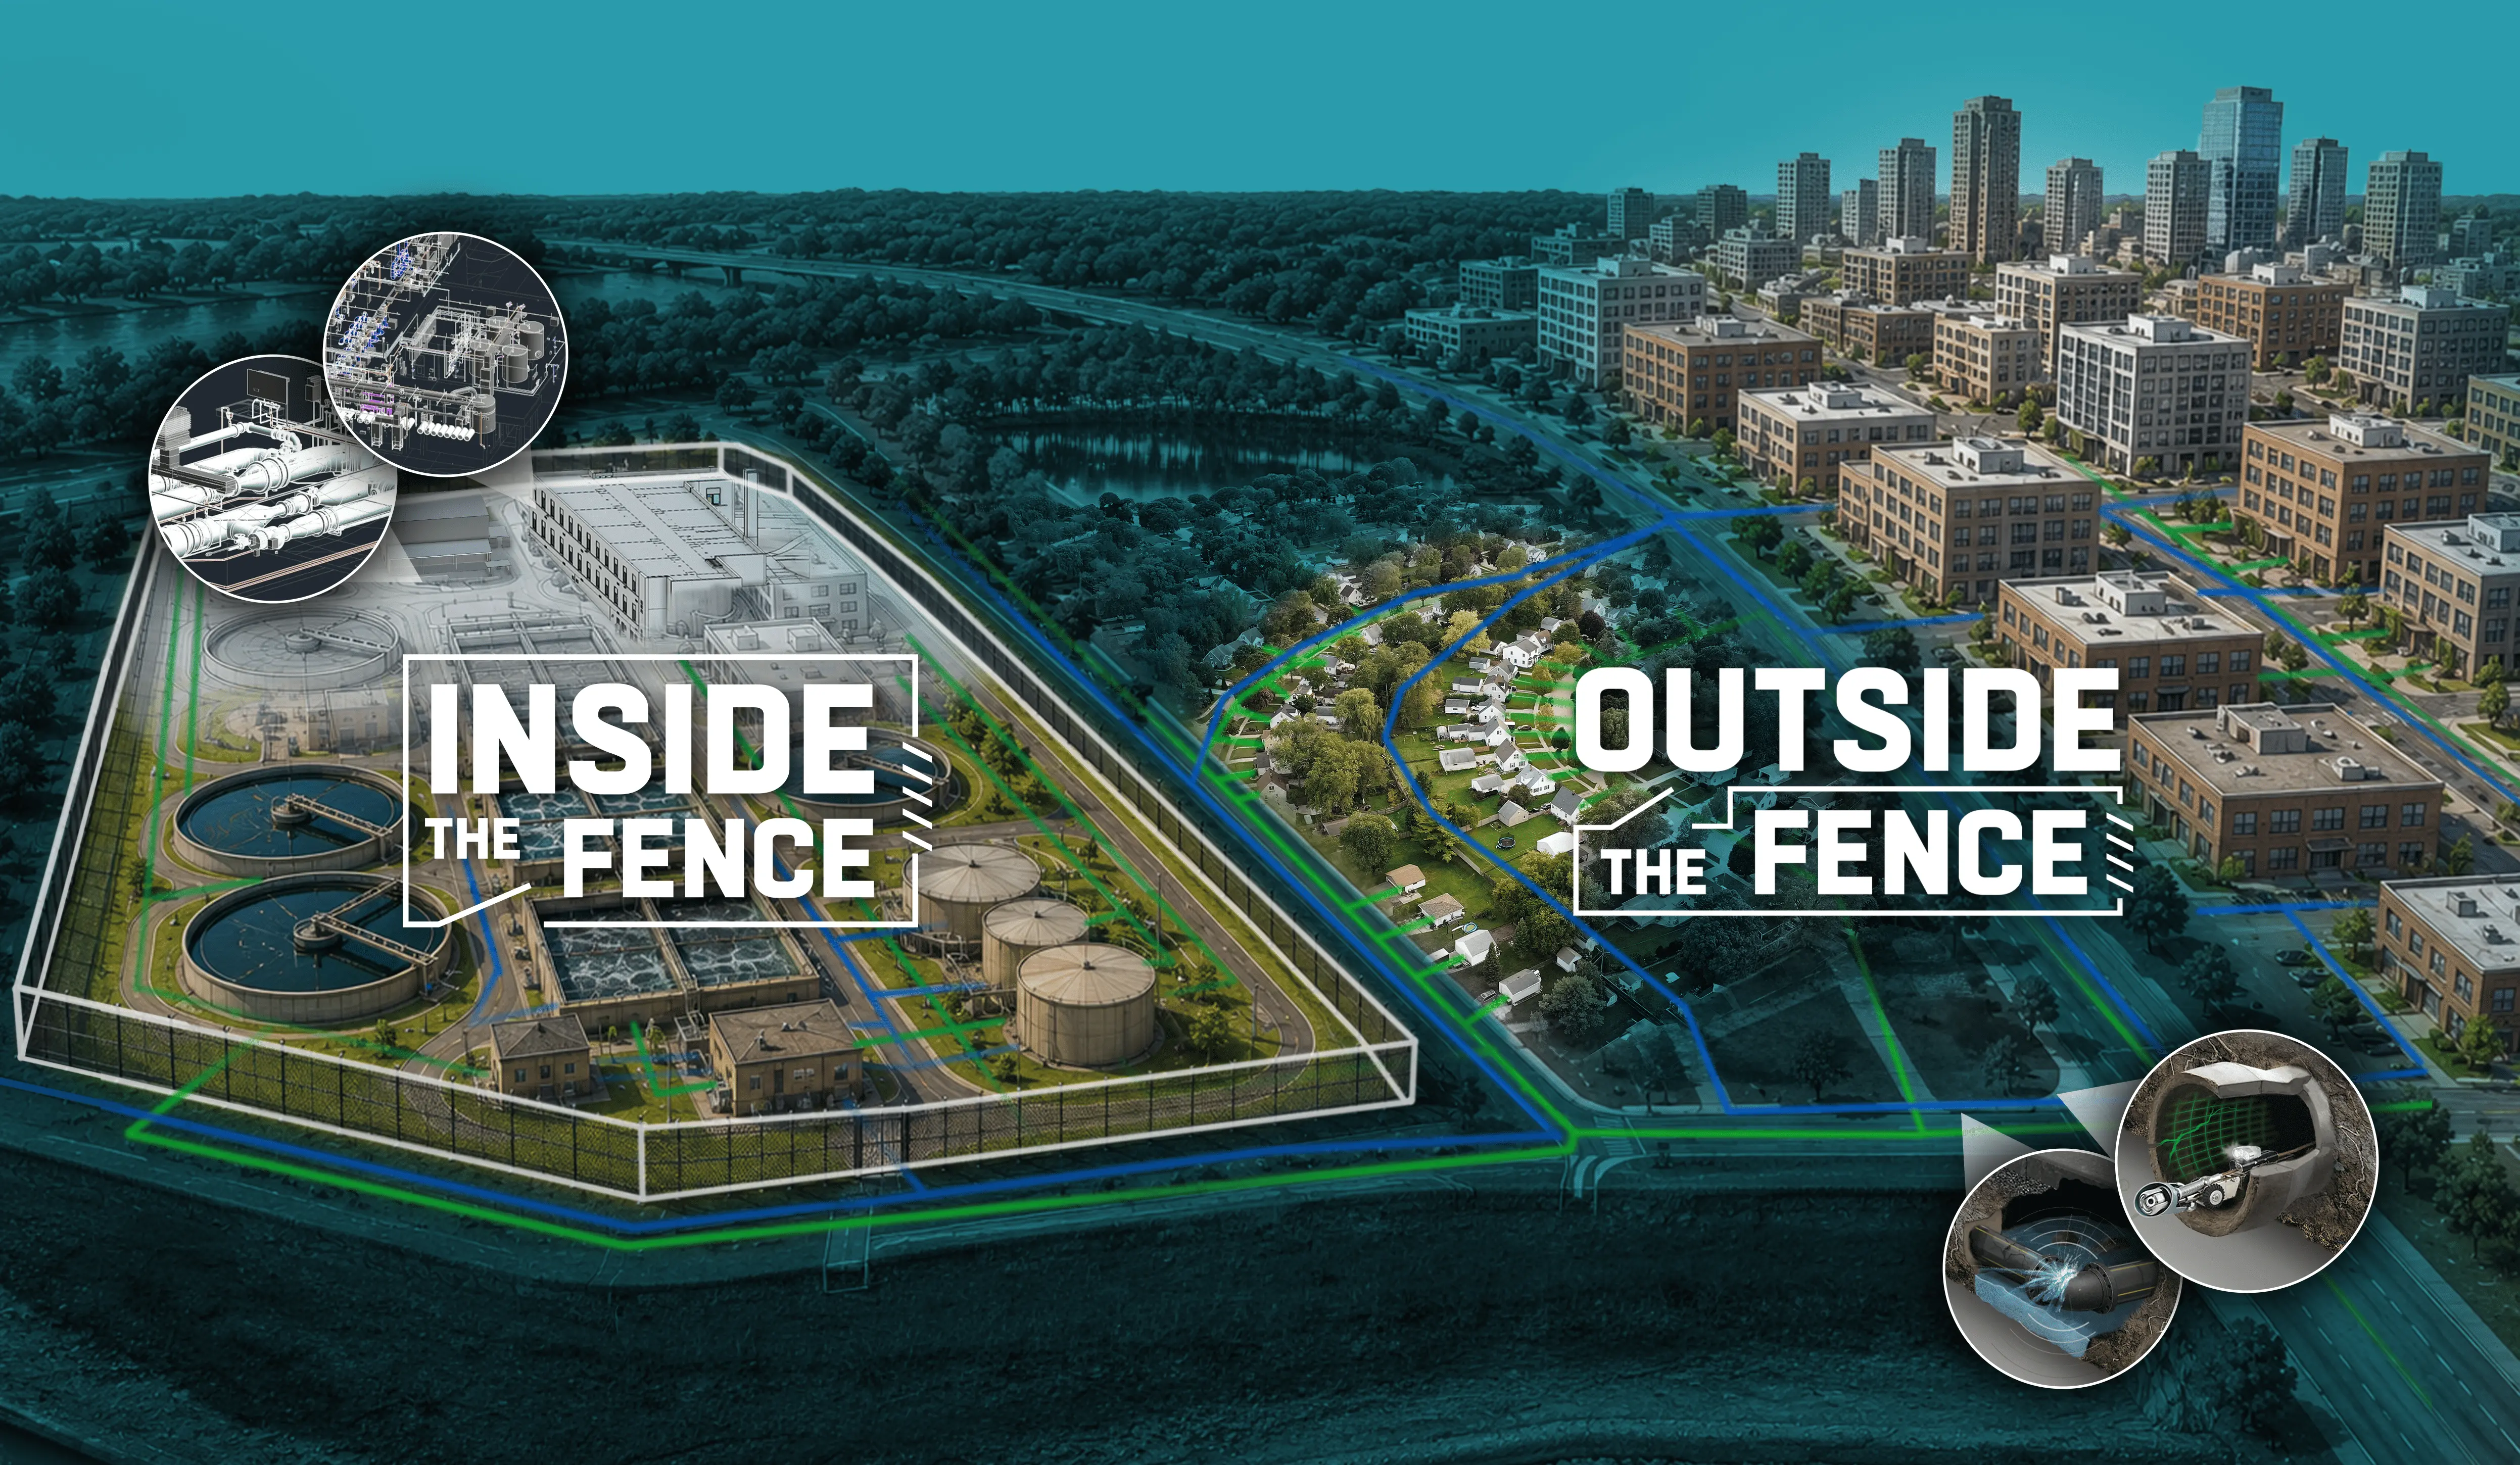
Access field-verified utility and infrastructure data above and below-ground in SiteMap®.
SAVE
Avoid utility strikes, potholing, and redesigns during engineering and construction.
SUpport
Document facility assets in 2D and 3D for O&M and capital planning.
SEE
Visualize your water and sewer infrastructure in SiteMap to plan repairs and maintenance.
SAVE
Reduce utility strikes, minimize project risks, and extend the life of critical assets with accurate infrastructure data.
SUpport
Make informed capital planning and maintenance decisions with comprehensive water and sewer system mapping and infrastructure inspections.

Industry Insights

America's infrastructure received a C- in the American Society of Civil Engineers' (ASCE) 2021 Report Card*


2.7 trillion gallons of water are lost annually to non-revenue water loss in the U.S. That’s enough to fill 3.78 million Olympic-sized swimming pools.


OUR INFRASTRUCTURE’S
INTEGRITY IS ON THE LINE
Join us in learning how to best maintain and protect this vital infrastructure.