

.svg)


If you are a concrete contractor, or a general contractor working with subcontractors, you know there are a number of project aspects that can be particularly challenging to get right. Collecting precise project data before, during and after a project and sharing that data with the field and the office fosters better communication and coordination, ultimately saving you time, money, and frustration.
Whether you are performing concrete inspection, layout or documentation, GPRS delivers solutions to expedite your project. 3D laser scanning helps concrete contractors and engineers better manage construction projects with precise data to aid decision making.
3D Laser Scanning for Concrete Analysis
Assessing concrete has previously relied on inherently unreliable methods for gathering information. The advent of 3D laser scanning has allowed contractors, inspectors, and designers to easily identify issues and reduce errors with millimeter-accurate data. Dimensional and tolerance assessments can be completed quickly to prevent costly project rework.
The current method for assessing concrete requires manual inspection and contact-type measurement devices, which are time consuming. The process for gathering information is prone to human error, documenting the information is tedious, and the platform to communicate is informal.
3D laser scan technology is transforming the way contractors document and assess concrete projects. It can measure floor flatness and floor levelness, scan pre-pour and post-pour, check tolerances and deflection, perform MEP and construction verification, assess structural concrete, prefabricate stairs and railings, inspect for ADA compliance, survey parking garages, assess concrete stairs, laser scan ground penetrating radar (GPR), and more.
GPRS 3D Laser Scanning services can help eliminate the headaches associated with the old ways of performing all these tasks.
3D Laser Scanning Applications for Concrete
What once took days to accomplish can now be completed within a matter of hours thanks to 3D laser scanning, which provides far more accurate data and better information than the old, manual assessment process.
3D laser scanners capture highly-accurate digital representations of project sites in 3-dimensional x, y, and z coordinates in the form of a point cloud. Scanners are self-leveling, positioned on a tripod, and set up around the perimeter of the construction site; they will not interfere with work in progress. Data is collected from a distance without physically touching the site. Site data can be analyzed virtually, and adjustments can be made to fix problems immediately.
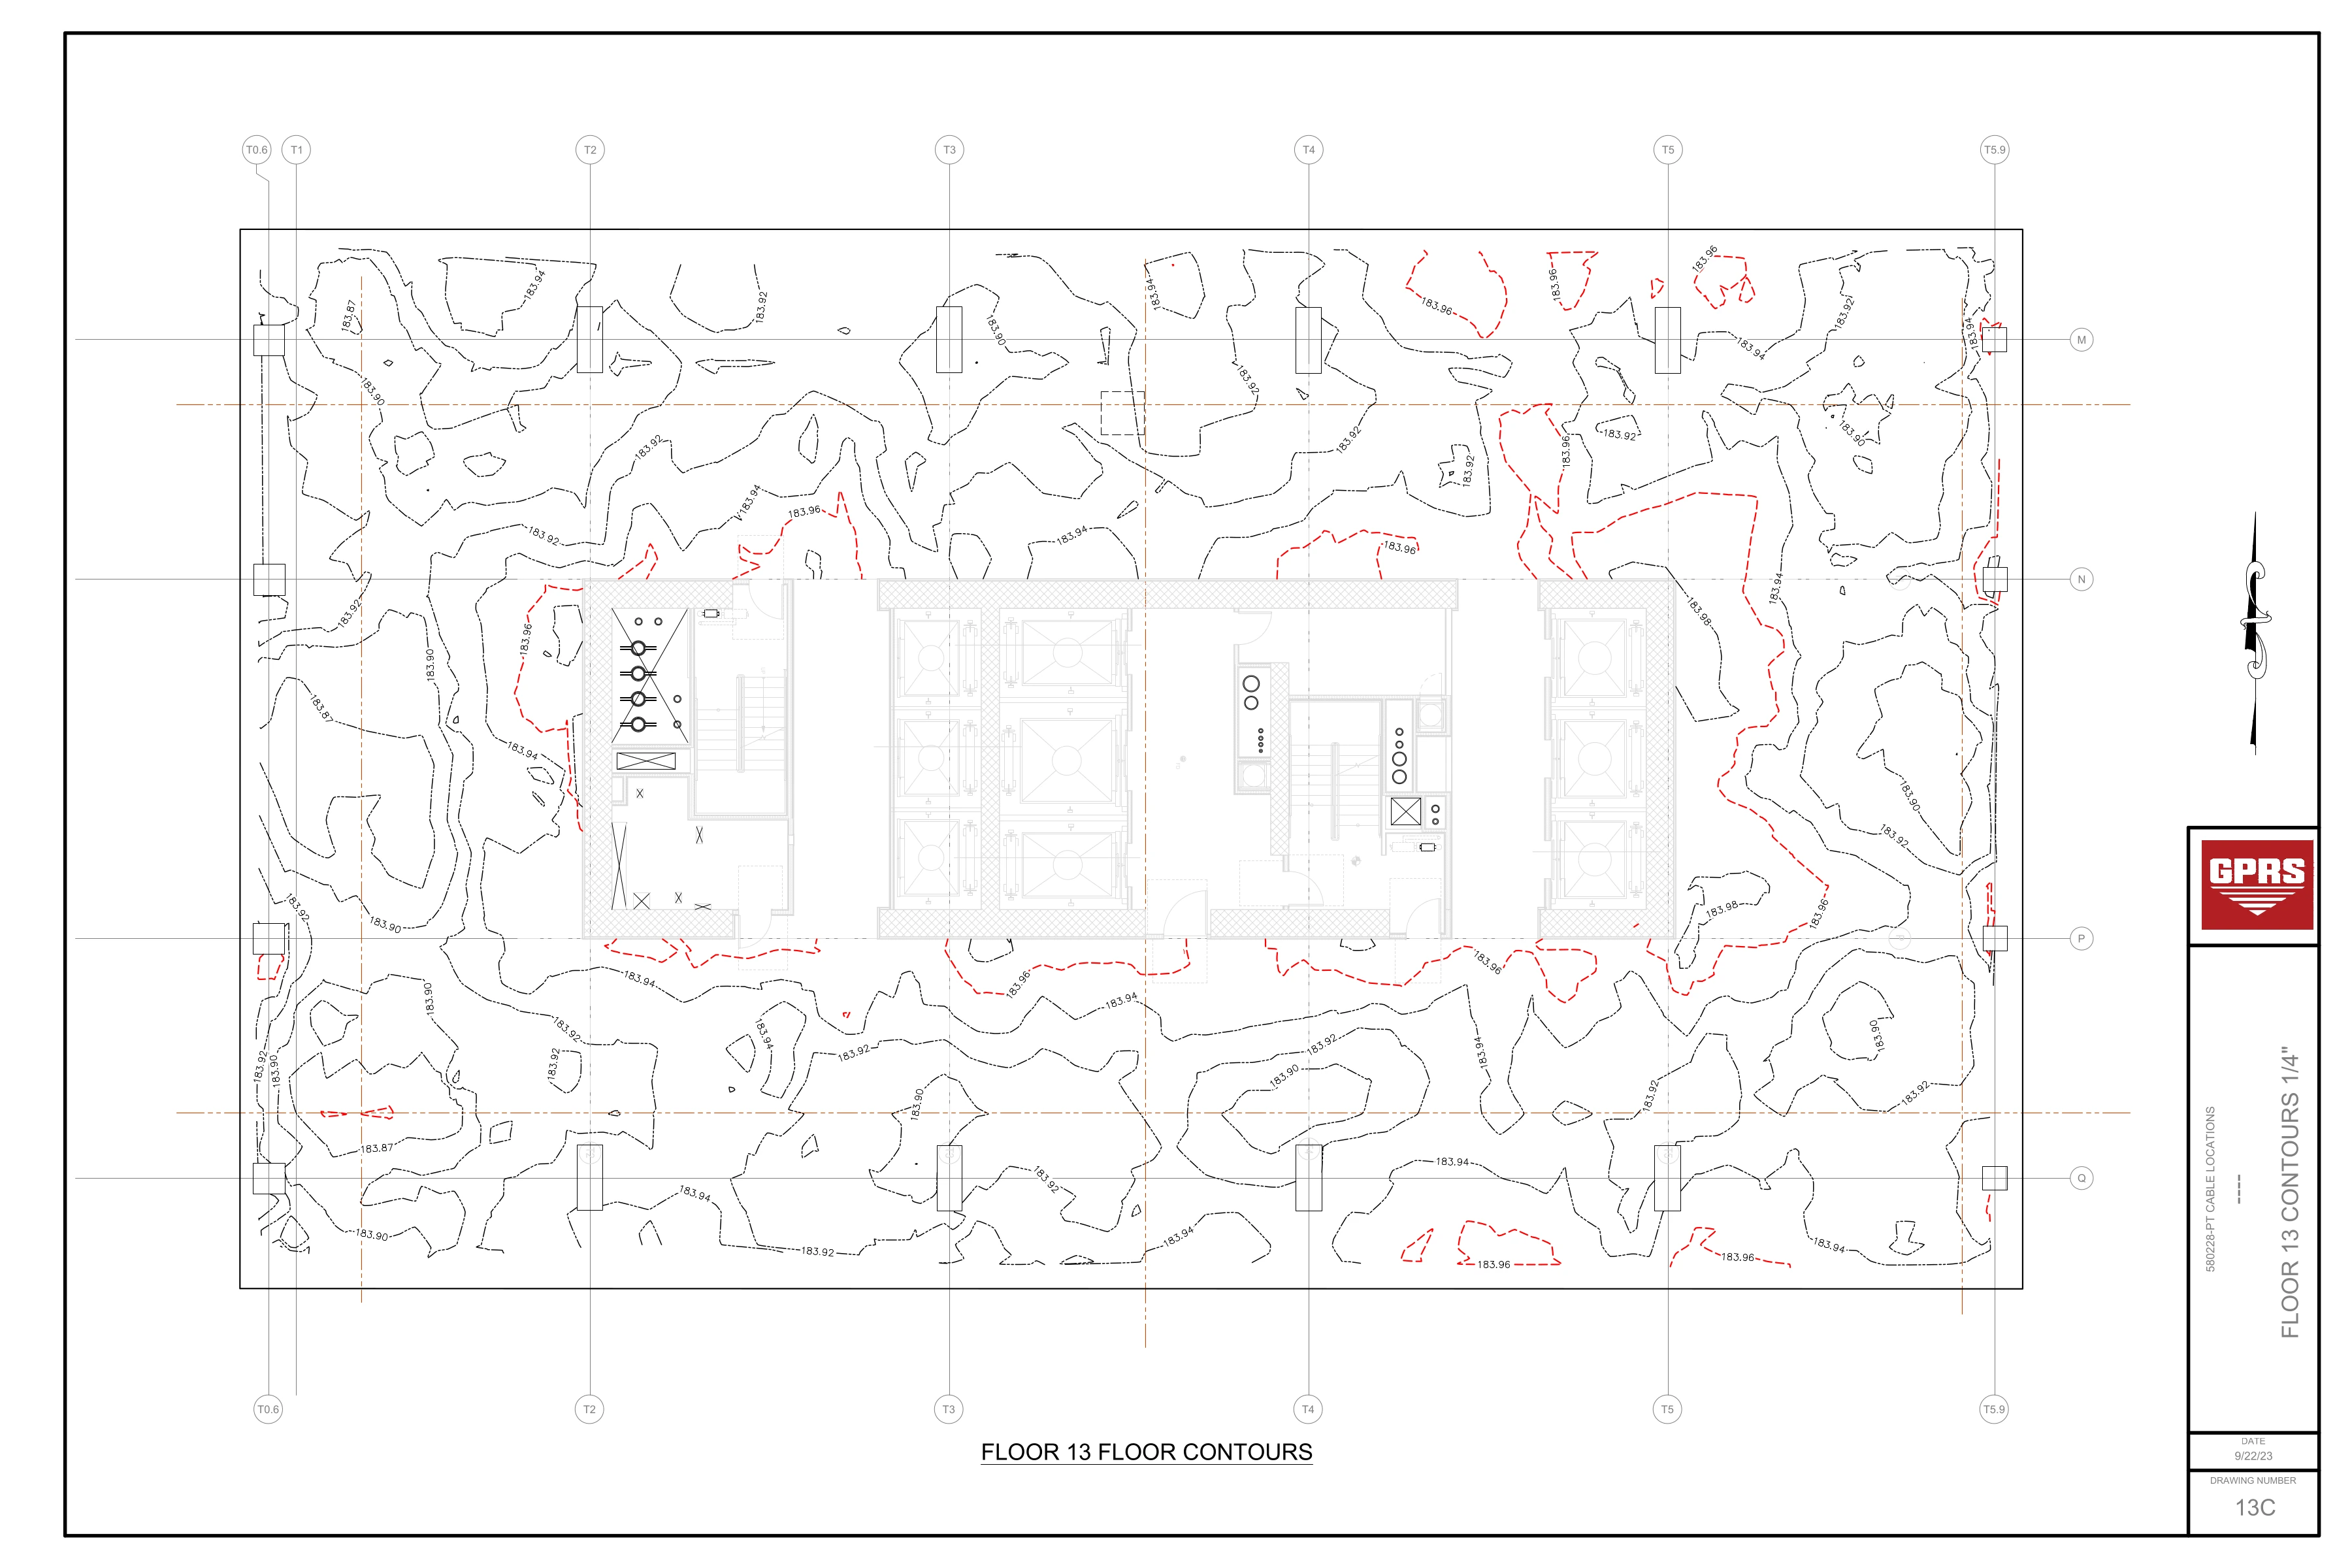
1. Floor Surface Contours
3D laser scanning can be used to create floor surface contours of concrete by capturing millions of precise measurement points across floors, slabs, and structures in a short amount of time. The 3D laser scanning process captures this data in the form of a point cloud, which can then be processed into floor surface contours.
Floor surface contours derived from laser scan data represent relative surface measurements only. Deliverables are intended for visualization and planning purposes and are not a land survey, elevation certificate, floor flatness report, engineering analysis, or certification of settlement, movement, or deformation.
2. Laser Scanning Concrete Pre-Pour and Post-Pour
Laser scanning is used to capture the pre concrete pour. Contractors use 3D laser scan data to demonstrate that the assets exist per the engineering drawings, giving complete pre-pour asset documentation from the start.
Laser scanning can capture the finished pour with millimeter accuracy to ensure the pour was compliant with the design. Also, once the slab has met strength targets, completed post tensioning, and all temporary shoring is removed, the slab can be laser scanned again. This provides the true deformation of the structure.

3. Laser Scanning for Tolerances
Laser scanning is rapidly being adopted to check tolerances. It provides contractors, inspectors, and designers with quantitative data. Contractors will know if concrete floors, walls, stairs, ramps, and columns are out of tolerance. Scans can be performed multiple times in the same area while construction proceeds.
3D laser scanning can also check the status of steel beams before and after concrete pouring to document the location of the steel beams, slab thickness and whether everything is in tolerance.

4. Laser Scanning for Deflection
3D laser scanning can measure concrete slab structural cracks and deflection. The deflection in slabs can occur over time due to settling, shrinkage, fatigue, design errors, aging, point loads, damage, and more.
Detailed information about existing conditions is documented in a point cloud, accurate to within millimeters. 2D drawings and 3D models can be created to document cracks and deflection and design a plan to correct it.

5. Laser Scanning to Verify MEP Concrete Work
3D laser scanning provides the ultimate solution for verifying MEP concrete work right in the field. Ensure all conduit, rebar, and embedded sleeves are in their proper place. Visualize and immediately identify problem areas, then use the documentation to communicate back to the field crew and office. 3D laser scanning can easily capture data for all surface types such as pre- and post-pour of concrete slabs, structures and MEP installations, in a fraction of what it would take to manually verify proper placement.
Once the concrete is poured, nothing can be changed. 3D laser scanning is a powerful tool to help monitor a project site to make sure everything is ready for a concrete pour. There is no need to risk discovering a problem when it is hard to go back. Data collected will be an asset for years to come, as it can be referenced for any future coring or drilling needs, showing where everything was embedded in the slab prior to pouring.

6. Laser Scanning for Construction Verification
Locate potential risks sooner with 3D laser scanning to capture real-time as-built verification directly at the jobsite. Laser scanning can be used to compare scans against the as-built drawings or model, detecting incorrect placements to fix errors quickly. Contractors and engineers can ensure their design plans are accurate and eliminate clashes before they turn into change orders.

7. Structural Assessment of Concrete
3D laser scanning can assess and document floors, ceiling slabs, walls, and columns of reinforced concrete buildings. This can be done to create as-builts, identify structural defects, or monitor shifts in the building over time. The spatial information of the point cloud helps make decisions based on accurate data. Identifying defects of components and completing virtual design planning to remedy them will minimize rework costs.

8. Prefabrication of Stairs and Railing Systems
3D laser scanning can document existing structural elements, staircases, walkways, and railing systems for prefabrication. All necessary measurements are captured and transformed into 3D BIM models, 3D mesh models, or 2D CAD drawings for better project planning, ensuring accuracy with little to no rework. Data ensures elements are prefabricated to the right specifications and expedites installation.

9. Inspecting Ramps and Cross Slopes for ADA Compliance
3D laser scanning can be used for inspecting ramps and cross slopes for compliance with ADA requirements. Curb ramps must meet specific standards for width, slope, cross slope, placement, and other features to comply with ADA requirements. The current methods used to inspect ramp and cross slopes include manual tape measures and levels. These methods are unreliable. Laser scanning documents ramps and cross slopes with 2-4mm accuracy in minutes. Point cloud data can be delivered quickly, or 2D drawings and 3D models can be created for site evaluation. Data allows contractors or engineers to virtually see the site and obtain measurements for redesign, if required.

10. Inspecting Parking Garages
3D laser scan data can be used to estimate clearances, measure slab thickness, measure the thickness and depth of beams, and assess ramps in parking garages. The point cloud data collected can be used to generate architectural drawings, elevation views, color elevation maps, and 3D models for contractors.

11. Assess Concrete Stairs
3D laser scanning can document concrete stair dimensions and step construction details. Tread height and depth can be compared to building code specifications. Data can be received in point cloud format, 2D CAD elevations and 3D models. This can be done for documentation repair and construction defect litigation.

12. 3D Laser Scanning GPR
3D laser scanning can capture ground penetrating radar (GPR) markings to accurately document underground utilities, rebar, and post tension cables located under concrete. 3D models and 2D site plans can be created to eliminate potential problems during construction and improve safety before cutting or drilling into concrete.

Ground Penetrating Radar Applications for Concrete
Any project involving post-tension or slab-on-grade concrete contains an inherent risk of costly damage and/or injury when you core or cut into the slab. Rebar, conduit, and post-tension cables pose significant strike risks, and each has its own unique GPR imaging signature. GPRS’ concrete scanning service provides digital concrete scanning with ground penetrating radar (GPR) to accurately pinpoint the location of each hazard and map it in detail, so there is never a question of where you can cut and where you can’t. Unlike concrete x-ray services, GPR concrete imaging does not require you to close off sections of your site to avoid radiation. In most cases, your work can continue while we scan and locate slab reinforcement and conduits with 99.8%+ accuracy, so that you can safely cut and drill.
1. Concrete Coring Applications
Because concrete drilling comes at a risk, GPRS Project Managers are equipped with multiple technologies to clear areas prior to core drilling and anchoring. Upon completion of the scanning process, you will have a clear layout of the vertical and horizontal position of impediments such as post tension cables, rebar, beams, and conduits. Our scanning and imaging services can be completed on any surface including concrete slabs, walls, columns, and beams.

2. Saw-Cutting Applications
As with concrete coring, when saw cutting in a slab-on-grade scenario, locating unseen or buried objects is crucial. The risk of severing post tension cables, rebar, conduits, pipes, grade beams, or other obstructions runs high in saw-cutting applications. In order to identify these hazards, our Project Managers follow a detailed process, which includes multiple GPR antennas and a variety of other technologies. This in-depth process results in accurate information about hazards that lie in and below the concrete slab.

3. Pre-Planning and Design
There are many critical steps when planning a construction project, but one of the most crucial steps is to obtain accurate information regarding where future concrete penetrations will take place. When GPRS has the ability to scan concrete structures prior to the construction phase, we are able to reduce costly change orders and limit the redesign process. Unlike traditional concrete x-ray, our technologies have the capability to scan large areas and can provide our findings in detail via a field sketch, CAD drawing, or even a 3D model.

4. Structural Analysis
Ground penetrating radar is most commonly used to clear areas prior to saw cutting or core drilling, but our scanning equipment also has the capability to deliver much more detail. Project Managers are able to determine key slab information for Structural Engineers, including rebar and post-tension spacing and depth, concrete cover and overlay thickness, concrete thickness, and even dowel placement. With GPRS’ ability to scan complete concrete structures, we are not limited by size for structural analysis.

Contact GPRS Today
GPRS 3D Laser Scanning can provide a complete digital documentation of any structure – top to bottom; slabs to columns; before, during, and after construction. It provides reliable dimensional data and quality assessments of concrete in a fraction of the time it takes with manual measurements. Checking the conformity of concrete levelness, dimensions and tolerances is important to prevent rework or failure during construction. GPRS Laser Scanning is a nationally recognized leader in 3D laser scanning. Our team is dedicated to serving clients, delivering the highest quality point cloud data, 3D models and 2D drawings on time and on budget.
Concrete scanning arms construction teams with the complete and precise detection, evaluation, and mapping of concrete, when preparing to cut, core, or drill into a structure. GPRS guarantees our accuracy and your safety with our exclusive Green Box Guarantee. Read about our Green Box Guarantee